MATLAB Plot A Comprehensive Guide to Data Visualization
In the world of data science, engineering, and numerical computing, MATLAB has earned its place as a go-to tool for visualization and analysis. One of its most powerful features is its ability to generate a wide variety of plots. Whether you’re a researcher analyzing scientific data or an engineer working on simulations, plotting in MATLAB allows you to transform complex numbers and calculations into clear, readable visuals. MATLAB’s plotting functions are not only intuitive but also incredibly flexible. From basic line graphs to 3D mesh surfaces and animated plots, MATLAB provides a robust platform for matlab plot visualizing any type of data. In fact, effective data visualization is often the key to uncovering insights, validating models, and communicating results clearly to stakeholders. In this article, we explore the breadth and depth of MATLAB’s plotting capabilities. We’ll cover everything from simple line plots to advanced 3D graphs, specialized plot types like polar and contour plots, and how to customize, export, and automate your visualizations. Whether you’re a beginner or a seasoned programmer, this guide will equip you with everything you need to master MATLAB plotting.
Basics of Plotting in MATLAB
Plotting in MATLAB begins with the foundational plot() function. It’s as simple as it is powerful. A basic 2D line plot can be created with a single line of code, like plot(x, y), where x and y are vectors of data. This initial plot can then be built upon by adding elements like axis labels, grid lines, and titles using commands such as xlabel(), ylabel(), title(), and grid on.
In addition to line plots, MATLAB supports a variety of basic charts including scatter() for scatter plots and bar() for bar charts. These plots are ideal for visualizing trends, distributions, and comparisons. The hold on command is particularly useful when plotting multiple matlab plot datasets on the same graph—it retains the current plot so that new plots are added to it rather than replacing it.
Customization is another major strength of MATLAB’s plotting toolkit. You can change line styles, marker types, and colors directly in the plot() command. For example, plot(x, y, '--or') plots a red dashed line with circle markers. These small tweaks can make your visualizations more engaging and informative, especially in professional or academic presentations.
Titles, labels, and legends are essential for plot clarity. Using legend('Series 1', 'Series 2') helps differentiate multiple data sets in the same plot, matlab plot while axis commands like axis tight or axis equal refine the visual boundaries of the chart. These elements turn raw plots into polished visuals that tell a story.
Advanced Plotting Techniques
Once you’re comfortable with basic plots, MATLAB offers a variety of advanced techniques to enhance your data visualization. For instance, you can easily plot multiple datasets in a single window using the subplot() function. This allows you to display several related graphs side-by-side or stacked, which is perfect for comparing trends across different variables.
Another way to manage multiple visualizations is with tiledlayout(), a more modern approach than subplot(), offering better control over layout and spacing. These tools help users build dashboards or compact visual summaries for reports and presentations.
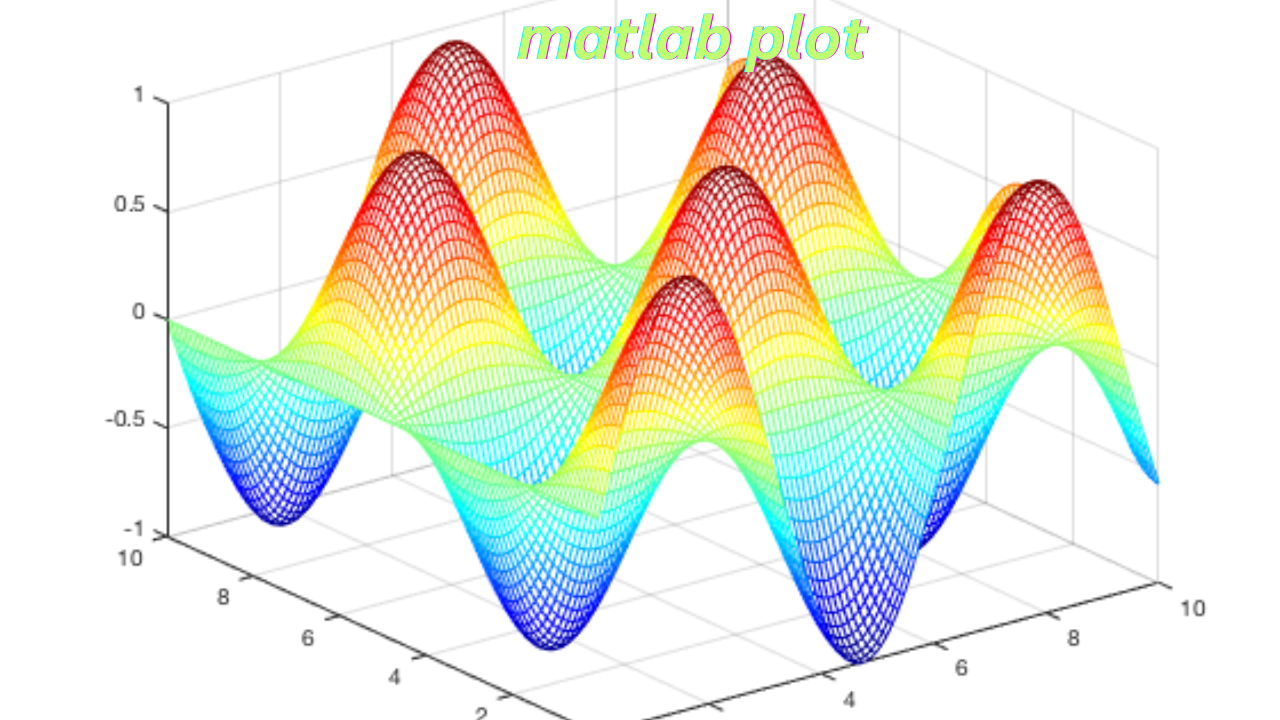
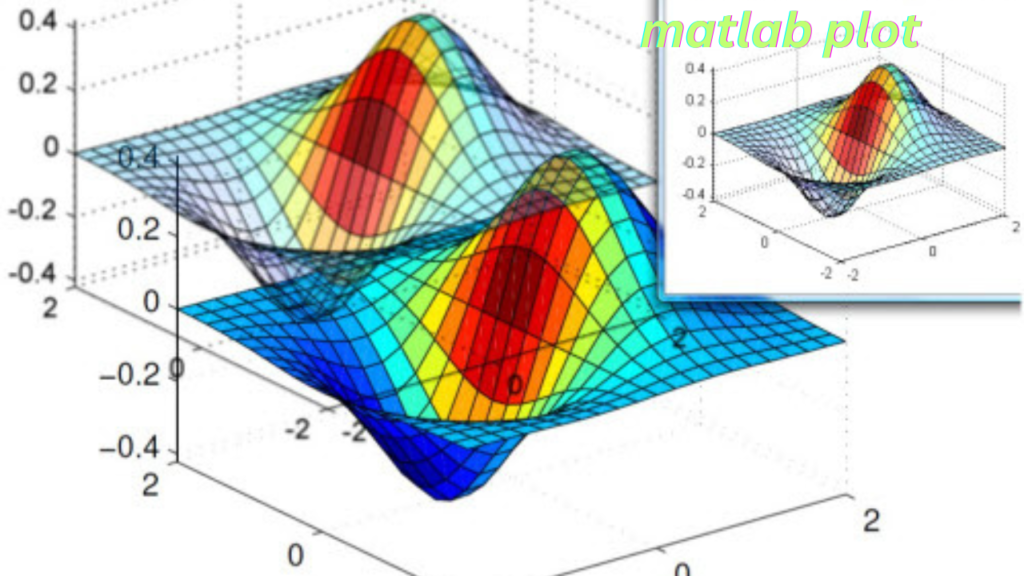
3D plotting in MATLAB is where things really start to get exciting. Using functions like plot3(), mesh(), and surf(), you can visualize three-dimensional datasets with striking clarity. These plots are crucial in fields like physics, engineering, and finance, where multidimensional models are common. mesh() and surf() plots, in particular, render 3D surfaces that can be color-coded for added depth and meaning.
Moreover, MATLAB allows fine-grained customization of plots at every level. Using the set() function or property-value pairs, you can adjust font sizes, axis limits, tick labels, and more. This level of control ensures your plots look exactly how you envision them—clean, informative, and publication-ready.
Specialized Plot Types in MATLAB
MATLAB supports numerous specialized plot types that cater to specific kinds of data visualization. For example, contour plots, created using the contour() function, are useful for displaying three-dimensional data in two dimensions, especially in fields like fluid dynamics or topography. These plots use contour lines to show levels of intensity or elevation.
Heatmaps are another powerful visualization tool, especially for correlation matrices or frequency tables. Created using the heatmap() function, they use matlab plot color gradients to represent data magnitude, making patterns easy to spot at a glance. Heatmaps are often used in machine learning for model evaluation or in genomics for gene expression analysis.
Polar plots (polarplot()) are excellent for circular or angular data, such as waveforms, wind directions, or antenna patterns. Meanwhile, MATLAB’s logarithmic plot functions—semilogx(), semilogy(), and loglog()—are invaluable for datasets spanning multiple orders of magnitude. They are commonly used in electronics, finance, and biology.
Finally, MATLAB allows the creation of animated plots that dynamically update data over time. These can be crafted using loops and the drawnow command. For interactive matlab plot plots, the App Designer provides a GUI-based platform to build applications with buttons, sliders, and real-time visualizations—ideal for user-driven data exploration.
Exporting and Saving Plots
Creating beautiful plots is just half the job—sharing them is the other. MATLAB makes it easy to export plots in various formats using the saveas() or print() functions. You can export high-quality images for publications in formats like PNG, JPEG, EPS, and even PDF. These formats are suitable for embedding in Word documents, LaTeX papers, or PowerPoint presentations.
Resolution matters, especially for print or large displays. MATLAB allows you to set the resolution (DPI) of your saved figures. A common practice is to use print(gcf, 'filename', '-matlab plot'-r300') for high-resolution exports. Additionally, you can specify the figure size using set(gcf, 'Position', [x y width height]) to match the aspect ratio of your layout.
If you frequently generate similar plots, automation can save a lot of time. By scripting your plot code inside a .m file, you can run it repeatedly with different datasets. This is particularly useful for batch processing simulations or comparing results from multiple experiments. Loops and conditional statements can be incorporated to generate customized plots automatically.
With these exporting and automation features, MATLAB ensures that your data visualizations are not only stunning but also reproducible and easy to share.
Conclusion
MATLAB is a powerhouse when it comes to data visualization. Its extensive plotting tools allow users to create everything from simple 2D charts to complex 3D surfaces and dynamic animations. Whether you’re analyzing signals, visualizing engineering data, or creating interactive dashboards, MATLAB gives you the tools to visualize data efficiently and effectively. The platform’s flexibility—from basic plots to fully customized figures—makes it suitable for both academic research and industry applications. Understanding how to properly use and present your data through plots not only enhances clarity but also improves decision-making and communication. As you continue working with MATLAB, experimenting with different plot types and customizations will expand your ability to uncover insights and tell stories with your data. The key is to match the right plot to your data and audience.
FAQs
How do I plot multiple lines in MATLAB?
Use hold on between multiple plot() commands to add lines to the same figure.
How do I make a 3D surface plot?
Use meshgrid() to create coordinate matrices and then surf() or mesh() to plot.
What’s the difference between subplot() and tiledlayout()?
tiledlayout() offers better layout control and is preferred for newer versions.
Can I save my plots as high-resolution images?
Yes, use print() with the -r300 flag for 300 DPI output.
Is there a way to make interactive plots in MATLAB?
Yes, MATLAB’s App Designer lets you build interactive GUIs for real-time plotting.
You May Also Read: https://networkinfonews.com/rfc-mexico/


Post Comment